The WT20 2022 wrapped up on the 13 November with England winning the trophy. As an Indian fan, I was personally disappointed with the manner of our loss versus England in the semi-finals. But England were deserving winners.
What follows is a high-level comparison of batting run and strike rates along with bowling economy rates for the top 8 teams in the super 12 stage.
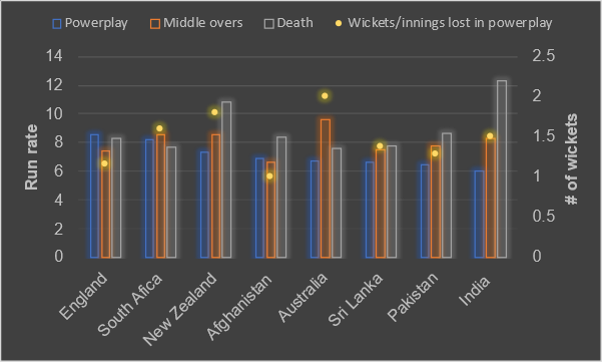
The powerplay scoring rates and death over economy rates (and wickets) provide good insights into the final outcome.
Batting run rates by innings phase,
Source: ESPNCricinfo
England went hard from the start and kept the momentum throughout. This is also influenced by a couple of their innings not really lasting into the death overs. They only faced 77 balls across 6 innings in the death overs as opposed to 140 for India in the same number of innings.
Conversely, India took a very traditional route of building in the powerplay and finishing with a flourish in the death. But a run rate of just over 6 was low, even by their standards. This put the death over batters under undue pressure. The loss against England in the semifinal showed that this approach no longer works – especially on good batting wickets.
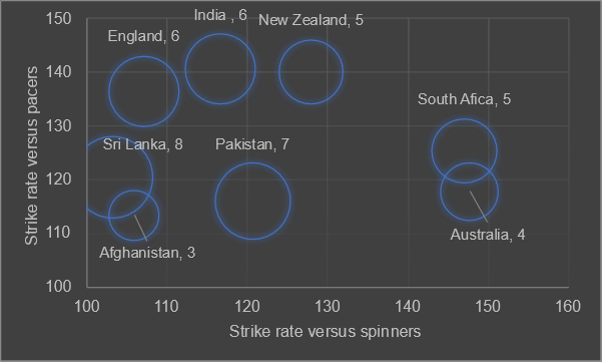
Batter strike rates by opposition bowling type
Bubble size represents number of innings by team; Source: ESPNCricinfo
The average strike rates across innings are really interesting as it suggests that three of the four semifinalists struggled against spin but where aggressive versus pace. At the other end, South Africa and Australia – neither of whom qualified for the final four – went hard against the spinners but struggled against pace relatively.
Pakistan is the most intriguing, as they seem to have a more balanced strike against all types of bowlers. This could easily be a function of the pitches and possible the kinds of totals they were chasing while batting second.
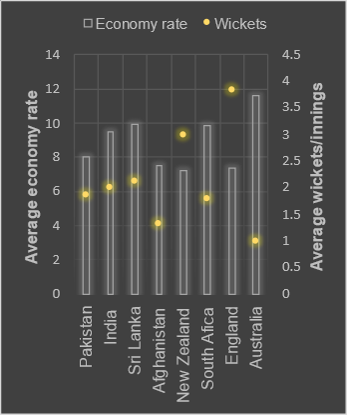
Bowling economy rates by innings phase
Source:ESPNCricinfo
Death overs bowling
Source:ESPNCricinfo
England really stand out with a very consistent economy rate (ER) through the innings. While India, Pakistan and Sri Lanka look very good in the powerplay – they went for plenty at the death. India of course had three very good power plays but were taken apart against Bangladesh and England in the early phase of the innings.
Furthermore, India’s inability to control the middle overs – an ER of over 8 – the largest phase of the innings was a key contributor to their woes.
Australia’s bowling woes also come through clearly and the match against New Zealand really influenced the overall numbers.
Where England really outdid the others was at the death. On average they picked up nearly 4 wickets at the death per innings – comfortable higher than the next best team – and this no doubt resulted in the lowest economy rate. This simply was the clearest differentiator in England’s case.